Put all of that data to use and increase your sales
Find out how Hotmart Analytics and our other platform resources give you what you need to put all of that data to use strategically.

What will we see in this post
First you draw up a plan, then you get to work. After you finish up a task, the planning cycle starts all over again.
There’s nothing wrong with this process, but it’s missing an important step: review.
Extracting the numbers of what’s been done and making sense of them is an essential element in the growth of a business. This step can help you see what you’re doing right and fix what you’re doing wrong.
By using the data, the next planning phase will be much more effective.
To give you the complete vision of the numbers related to your business strategy, Hotmart provides you with a variety of reports within different tools. Keep on reading and learn all about each one.
How Hotmart Analytics can help you use data strategically
Hotmart Analytics is a data analysis solution built for Producers and Affiliates. Since it is fully integrated in the Hotmart universe, the tool brings a complete vision of your sales and campaign results, in addition to personalized reports and the ability to break things down according to segments you’ve created.
In practice, you’ll find the data that will help you visualize and organize what is happening with your product every step along the journey of your pages, be it your blog, landing page, or sales page, among others.
Perfect for giving you the power to take action at the right moment, don’t you think?
In a highly organized fashion, you’ll get a detailed look of:
- Traffic origin (SRC, SCK, and UTM);
- Total number of visitors and the most accessed pages;
- Metrics on conversion and the use of each page tracked by code;
- Rankings of the best performing Affiliates with each product;
- The sales flow that is bringing the best results;
- Sales traffic results according to device, campaign, origin, or affiliation;
- Which pages are being accessed most;
- Which paid traffic channels bring the best return on investment;
- Most used payment forms;
- Customer behavior after the purchase.
And a whole lot more!
Just for the sake of example, you’ll get a better understanding of the behavior of leads when the time comes to buy. This is done by collecting the data on payment methods used, most relevant types of checkout, origin, and types of devices used.
Imagine that by looking over an analysis you could find that the majority of customers that purchase on their mobile prefer paying with Venmo, while folks on their home computers like to use their credit card more.
Wanting to optimize your paid traffic campaigns, you could separate your ads by computer and mobile. In the ad copy for desktops, highlight payments with credit cards, and in the ad for mobile, talk about Venmo.
To get your wheelhouse going on how to perfect your strategies based on the data, let’s toss around a few more ideas:
- Make alternative pages with different offers and test which ones have a better return.
- Use the history of other products to compare results and repeat what worked before.
- Study the profile of your customers from data collected and create new products based on the analysis.
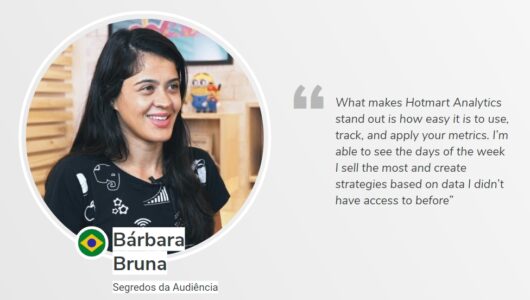
- Spot which days and times have the most sales and set up your paid traffic to happen at the most opportune moments. While we’re already on the topic, take a look at this tip from Barbara:
To start using Hotmart Analytics right now, you just need to install the tracking code on the pages you want data collected from. It’s easy to do. You can check out this step-by-step on how to use the Hotmart tracking code on your site.
So far, you’ve learned about Hotmart data analysis, now let’s take a look at the business results.
How to find business results data analysis
To better understand your business’s results, you can count on reports straight from the Hotmart platform. Documents are available for creators, affiliates, and cocreators.
- The Payment Method shows you which methods of payment are being used most.
- With Generated Commissions you can check the fees paid, payment dates, and commissions generated by profile type.
- In Customers, you can see the list of buyers and the purchase information.
- And with Collected Leads, find out which leads have been collected via HotLeads, in addition to tracking the performance of Affiliates.
Check out which reports you’ll also find among the Reports section:
- Revenues per Product
- Detailed Revenue per Product
- Revenues per Device
- Self Billing
- Sales per Country
- Purchase Recovery
- Subscription Status
- Affiliates Performance
- Rejection Reasons
- Coproduction Revenues
- Sales per Origin
- Performance of Promoted Products
- Sales per Checkout Origin
- Customer Satisfaction
And a lot of other report options!
To get to this section on the platform, just log in on Hotmart and and click on Reports in the left-side menu.
With this information in hand, you can track what is happening with your business in real time. Beyond this, you can react with more agility, avoid unsatisfactory results, and increase sales opportunities.
More data, more analysis, more chances to improve
Do you use Hotmart’s free Members Area? If you don’t, here are some reasons you should start right now. If you do, find out how to check the access data of your users.
With no headaches involved, you can see who is most engaged with your product, student performance, and a lot more. You can even create segmentations with the most relevant indicators for your type of business and take action in batches.
To check all of this valuable information out on your Members Area, just follow the steps below:
- Access the Hotmart platform: https://app-vlc.hotmart.com/
- Click Products in the side menu
- Select I’m a Producer
- Choose the product you wish
- Click on Members Area
- After opening the Members Area, click on Users
All set! Check out all of the reports and dashboards you’ve got.
So, what do you think? Now, it’s time to collect the data and use the numbers to improve your strategies even more.
Best of luck and happy selling! : )