Google Search Console: The Complete Guide for 2027 (What It Is, How to Use It and How to Get Insights)
Learn how Google's free tool reveals the searches behind your clicks, flags indexing problems and turns performance data into clear next steps for growing your website.

What will we see in this post

You publish content, build pages and put time into your website, but do you know which searches bring people to you? And when a page disappears from Google, can you tell why? That’s exactly what Google Search Console shows you, for free and with data straight from Google.
In this guide, you’ll go from the basics (what it is and how to set it up) to the reports that matter and 9 practical ways to turn the data into more organic traffic. Ready? 🚀
| Question | Quick answer |
|---|---|
| What is it? | A free Google tool that shows how your website appears in Google Search |
| What is it for? | Seeing which searches bring people to you, tracking clicks, impressions, CTR and position, and fixing crawling and indexing issues |
| How do I get started? | Add your site at search.google.com/search-console, verify the property and submit your sitemap |
| Where are the opportunities? | In the Performance report: keywords between positions 8 and 20 and pages with low CTR |
| What’s new? | A report on impressions in AI Overviews and AI Mode, a branded queries filter, chart annotations and data for Instagram, TikTok, X and YouTube profiles |
What is Google Search Console?
Google Search Console is a free Google tool that shows how a website appears in Google Search: which searches it shows up for, how many clicks and impressions it gets, which pages are indexed and which issues keep other pages from showing up.
Think of it as your car’s dashboard: Google Analytics counts how many people are inside the car, while Search Console tells you whether the engine is running and which roads people are taking to reach you. The tool is part of Google Search Central, Google’s set of documentation and tools for people who manage websites, and all it takes is a Google Account and proof that the site is yours.
Search Console used to be called Google Webmaster Tools, a name you’ll still see in older tutorials. And you don’t need to sign up for it to show up on Google: the search engine finds and indexes websites on its own, and Search Console helps you understand and improve that presence.
Is Google Search Console free?
Yes, Google Search Console is completely free and has no paid plan, whether you run a personal blog, an online store or a sales page. It’s one of Google’s free tools for website owners, alongside names like Google Analytics and Google Trends.
There are some practical limits, though: the Performance report keeps the last 16 months of data, and the tables in the interface show up to 1,000 rows. If you need more, Google offers the Search Console API, the Looker Studio connector and bulk data export to BigQuery.
What Google Search Console is used for
Google Search Console is used to track and improve a website’s presence in Google Search, with official data from the search engine itself. With it, you can:
- find out which searches your site appears for and which of them lead to clicks;
- track clicks, impressions, CTR and average position over time;
- check whether Google can crawl and index your pages;
- submit your sitemap and request indexing for new or updated pages;
- get alerts about errors, security issues and manual actions;
- measure page experience with Core Web Vitals;
- see how your site shows up in Google’s AI features, such as AI Overviews and AI Mode.
That’s why Search Console is a must for anyone who relies on organic traffic, such as blogs, online stores, portfolios and sales pages.
How Google Search Console works
Google Search Console works with Google’s own data, collected along the path every page takes before it gets a visit from search:
- crawling: Googlebot discovers the page through links or the sitemap and reads its content, following the rules in the robots.txt file. Today, Google crawls mainly with the smartphone version of its bot (what’s known as mobile-first indexing);
- rendering: Google runs the page’s code (HTML, CSS and JavaScript) to see what a visitor sees;
- indexing: Google decides whether the page goes into the index, the huge database that search results come from. This is also where it picks the canonical URL, the main version when there are similar pages;
- serving and clicks: when someone searches, pages in the index compete for positions, and every time yours shows up it counts as an impression; if the person clicks, it counts as a click.
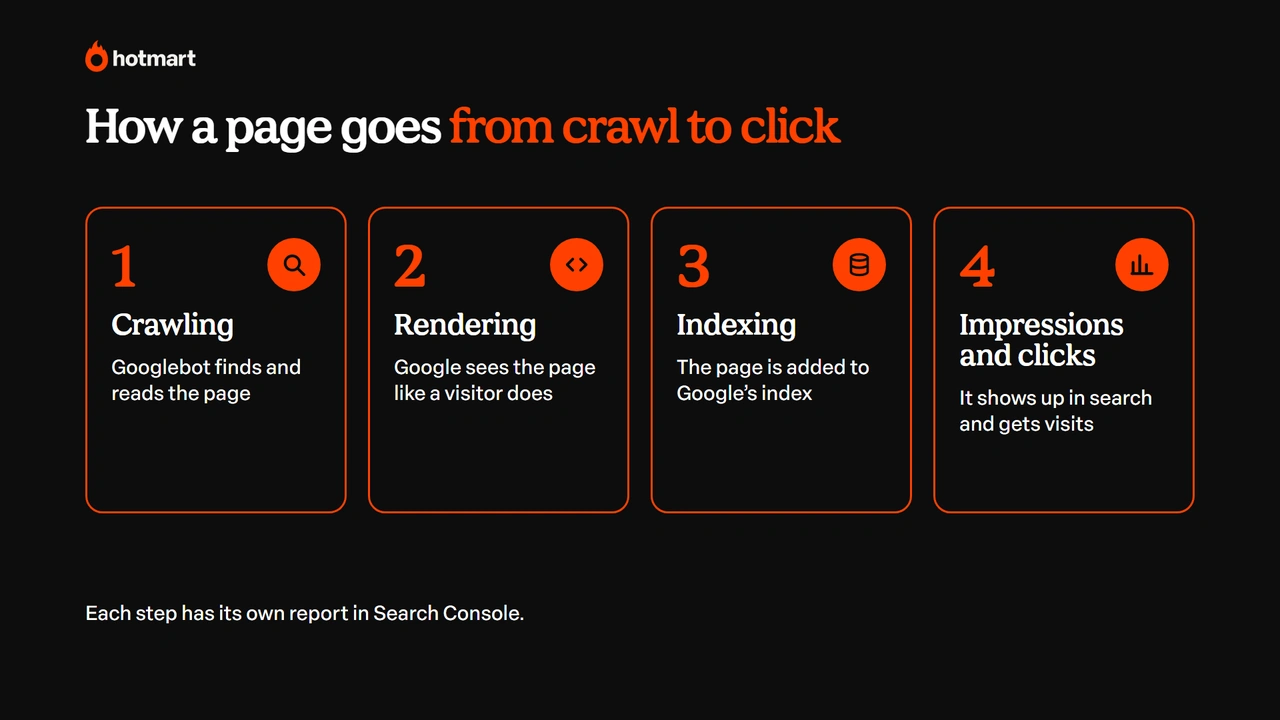
Each stage has its own report in Search Console. Crawling issues show up in Crawl stats and the robots.txt report, indexing issues show up in Page indexing, and serving and clicks show up in Performance. Once you know which stage the problem is in, you know where to look.
A few details help you read Search Console data without jumping to the wrong conclusions:
- the most recent data is preliminary: it shows up as a dotted line on the chart and is finalized over the following days. To keep up with what just happened, there’s a last 24 hours view with hourly data;
- position is an average: it takes into account every time the page appeared, across all searches in the period;
- rare queries are hidden: for privacy reasons, Google leaves the so-called anonymized queries out of the table, but they’re still included in the chart totals;
- history goes back 16 months: to compare longer periods, you need to export and store the data.
Google Search Console terms you need to know
The Google Search Console terms below show up in every report:
| Term | What it means |
|---|---|
| Property | The website (or part of it) that you added and verified in Search Console |
| Query | The search term someone typed into Google that made your site appear |
| Impression | Each time a link to your site appears in the results for someone |
| Click | Each time someone clicks your result and leaves Google for your site |
| CTR (click-through rate) | Clicks divided by impressions. E.g.: 50 clicks out of 1,000 impressions = 5% |
| Average position | The average position of your result in the searches where it appeared |
| Crawling | Googlebot’s visit to read the page |
| Indexing | Adding the page to Google’s index, which it needs in order to show up in search |
| Canonical URL | The main version of a page, chosen when there’s similar or duplicate content |
| Sitemap | An XML file that lists the site’s pages to make crawling easier |
Google Search Console vs. Google Analytics: what’s the difference?
The difference between Google Search Console and Google Analytics is the moment each one measures: Search Console shows what happens before the click, in Google Search; Google Analytics shows what happens after someone lands on your site, from any channel.
| Google Search Console | Google Analytics | |
|---|---|---|
| Where the data comes from | Google Search (plus Discover and Google News) | Website visits, from any source |
| What it measures | Impressions, clicks, CTR, position, indexing and technical errors | Users, sessions, page views, events and conversions |
| The question it answers | “How do people find me on Google?” | “What do people do on my site?” |
| Example use | Finding a keyword in position 12 to optimize | Checking whether blog visitors clicked the buy button |
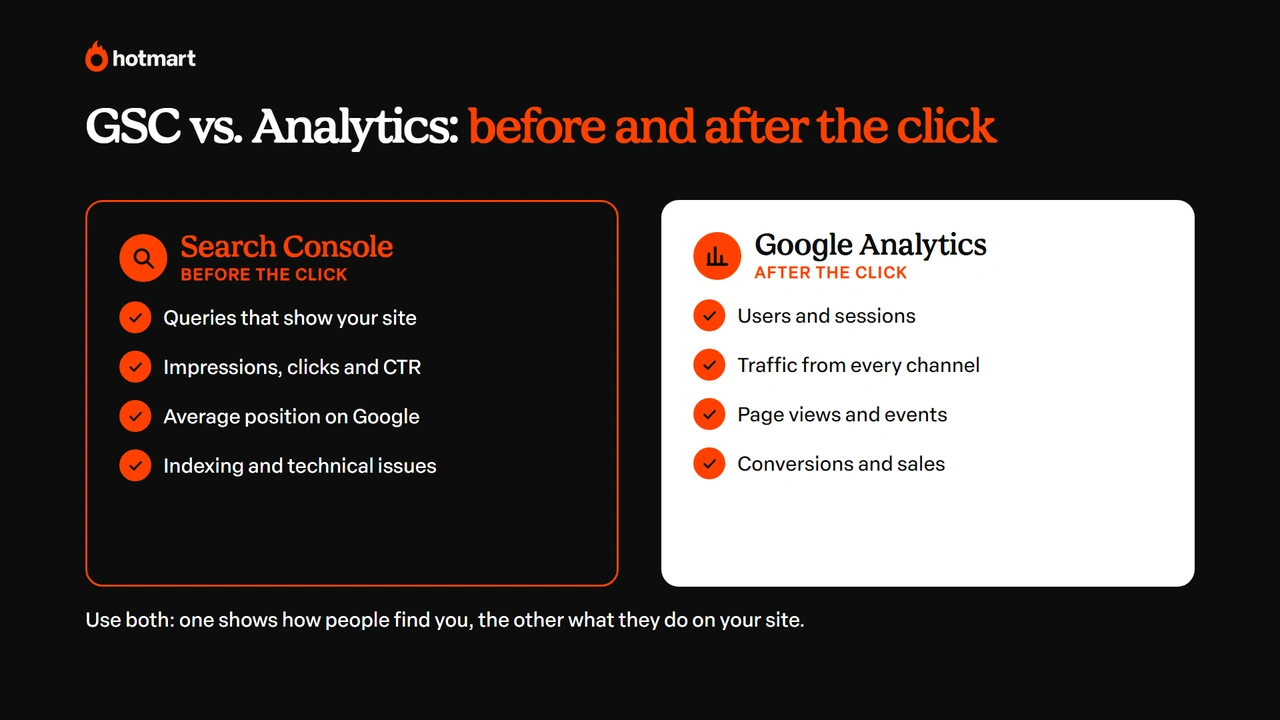
The two tools complement each other. You can connect Search Console to Google Analytics 4 (GA4) to see search queries next to visitor behavior and understand the journey from first contact to conversion.
The numbers from the two tools won’t match, and that’s normal: Search Console counts clicks in Google Search, while GA4 counts sessions on the site, which depend on cookie consent, ad blockers and whether the page fully loads. Use each one for what it measures best.
How to set up Google Search Console
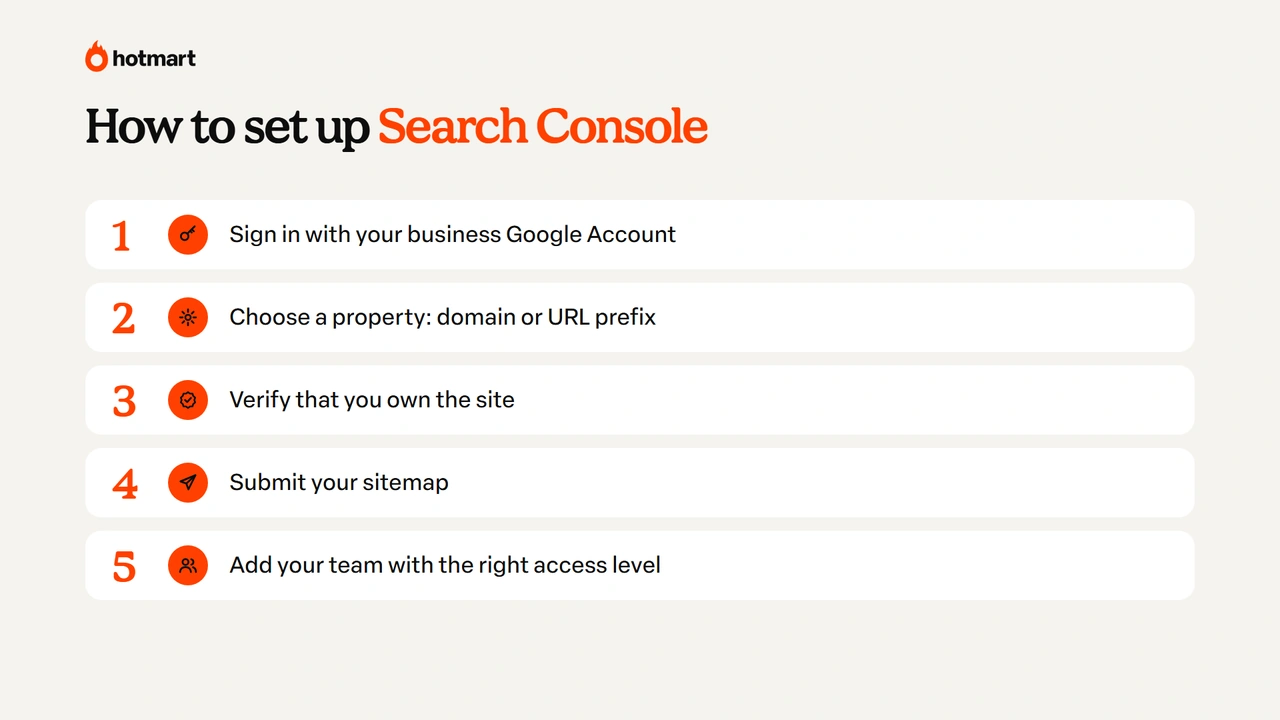
Setting up Google Search Console takes just a few minutes, and the most important step is verification, which proves to Google that the site is yours:
- sign in to Search Console with your Google Account;
- choose the property type;
- verify that the site is yours;
- submit your sitemap;
- add your team members.
Below, we walk you through each step.
1. Sign in to Search Console with your Google Account
Go to search.google.com/search-console and sign in. Use your business account rather than a personal email that could get lost if someone leaves the team. If it’s your first time, Search Console opens straight to the screen for adding a site.
2. Choose your Search Console property type: Domain or URL prefix
Search Console has two property types for websites, and your choice changes what you’ll see:
| Property type | What it covers | How to verify | When to choose it |
|---|---|---|---|
| Domain (e.g.: yoursite.com) | Every version of the site: with and without www, http, https and subdomains | DNS record only | When you have access to your domain settings and want the full picture |
| URL prefix (e.g.: https://www.yoursite.com/) | Only addresses that start with exactly that prefix | HTML file, meta tag, Google Analytics, Google Tag Manager or DNS | When you don’t have DNS access or want to track just one part of the site |
There’s also a third type, the platform property, for Instagram, TikTok, X and YouTube profiles. We’ll cover it later on.
3. Verify your site in Google Search Console
For a Domain property, Search Console shows a TXT record that you copy and paste into the DNS settings at your domain registrar (GoDaddy, Namecheap, Squarespace Domains, etc.). It can take a few hours to propagate.
For a URL prefix property, the easiest option is usually the meta tag: Search Console generates a line of code to add to your site’s header. If your site runs on WordPress with one of the popular SEO WordPress plugins, like Yoast or Rank Math, you’ll find a dedicated field to paste that code without touching your theme. If the site already has Google Analytics or Google Tag Manager set up with the same account, verification may happen automatically.
If verification fails, check whether the code was added to the right version of the site (with or without www), whether the cache was cleared and whether the DNS has propagated. Then just click Verify again.
4. Submit your sitemap in Search Console
The sitemap is the file that lists your site’s pages to make Google’s job easier. It’s usually found at addresses like /sitemap.xml or /sitemap_index.xml (Yoast’s default). In the Sitemaps menu in Search Console, paste the address and click Submit. Over the following days, the report shows how many URLs were discovered.
5. Add your team members
Instead of sharing your password, add users under Settings > Users and permissions. Search Console has different access levels:
- Owner: full control, including adding and removing people;
- Full user: sees all the data and can take some actions;
- Restricted user: can only view most of the data.
That way, your agency, freelancer or developer gets access to what they need, and you stay in control of the property.
Main Google Search Console reports
The main Google Search Console reports fall into those that show performance (how the site appears and gets clicked) and those that show technical health (whether Google can read and display your pages). The table below sums up each one:
| Report | What it shows | When to check it |
|---|---|---|
| Performance | Clicks, impressions, CTR and position by query and page | Every week |
| Insights | A summary of performance, plus trending content and queries | Every week |
| Generative AI features performance | Impressions in AI Overviews and AI Mode | Every month |
| Page indexing | Which pages are or aren’t in the index, and why | Every month and after changes to the site |
| URL Inspection | The status of a specific page | After publishing or updating |
| Core Web Vitals and HTTPS | Page experience and connection security | Every month |
| Rich results (Enhancements), Security issues and Manual actions | Structured data errors, hacks and manual penalties | When you get an alert |
| Links | The sites and pages that link to you most | Every quarter |
| Settings (Crawl stats, robots.txt report, Change of address) | Crawl health and domain migrations | Every month and during migrations |
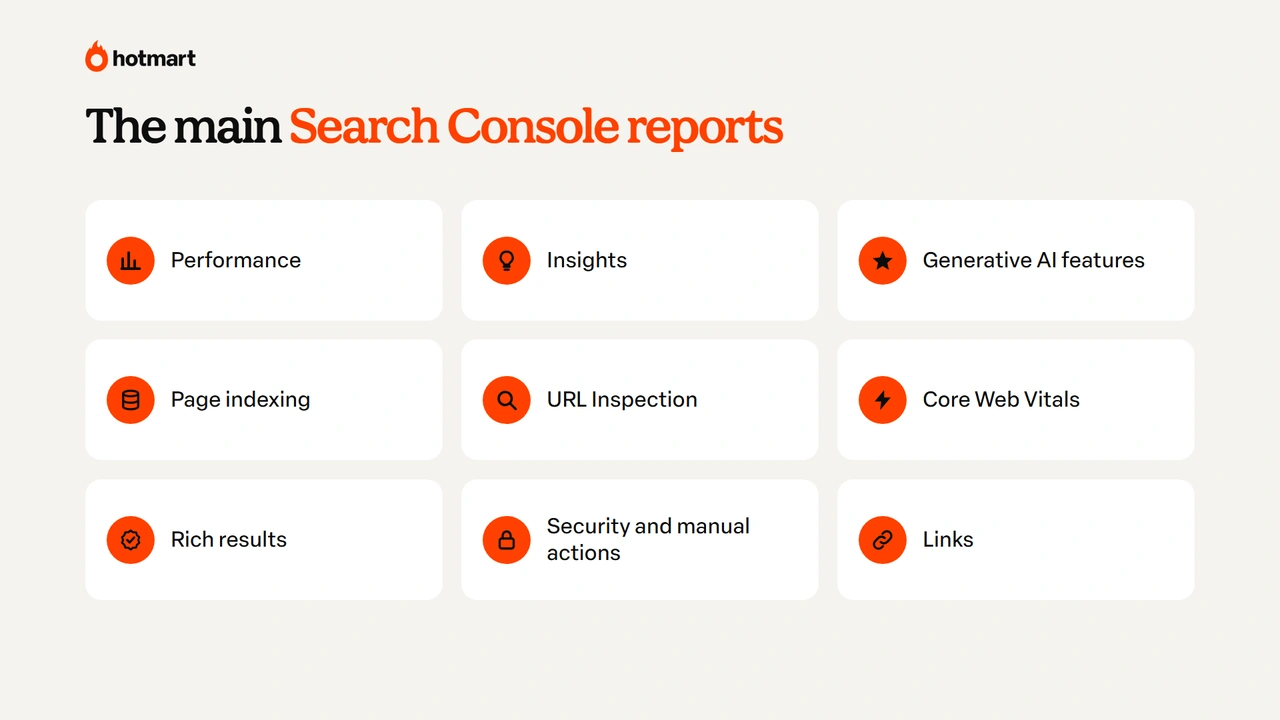
Before diving into the reports, it’s worth checking the Overview: that’s where Search Console’s Recommendations live, optional suggestions grouped into issues, opportunities and configuration.
It’s also good to know what has been removed from the tool. The Mobile Usability report was retired in December 2023, the Page Experience report went next, and the Sitelinks search box report disappeared when the feature was removed from search results in November 2024. If you come across these names in older tutorials, now you know why.
Search Console Performance report
The Search Console Performance report shows how your site appears in Google Search, with the four metrics from the terms table (clicks, impressions, CTR and average position), broken down by queries, pages, countries, devices, search appearance and dates. The features that help the most with analysis are:
- regular expression (regex) filters and date comparisons;
- the branded queries filter (November 2025), which separates searches that include your brand name from generic ones;
- chart annotations (November 2025), for marking events such as a content update;
- weekly and monthly views (December 2025), which smooth out daily ups and downs.
The report is split into Search, Discover and Google News. Since September 2026, it also has a filter for image-based searches, such as Google Lens and Circle to Search.
Search Console Insights
Search Console Insights is the report that sums up your site’s performance in plain language, designed for people who aren’t specialists. Built into the main interface in June 2025, it shows how clicks and impressions are trending, which content and queries are rising or falling, your top countries and the split between branded and non-branded traffic.
In October 2025, Insights added query groups: Google’s AI bundles similar searches under one topic, so you see the subject instead of dozens of scattered variations. The feature is available for sites with a large volume of queries.
Generative AI features performance in Search Console
The generative AI features performance report shows how many times your site’s pages appeared in Google’s AI answers, such as AI Overviews and AI Mode, and in Discover’s AI features. Launched in June 2026 and rolled out to all sites on August 31, 2026, it shows impressions by page, country, device and date.
For now, the dedicated report only shows impressions; clicks from these features are included in overall performance. It arrived along with a control that lets site owners decide whether their pages can appear in generative AI answers. If you turn it off, you stop getting impressions and traffic from these features.
Page indexing, Sitemaps and Removals in Search Console
The Page indexing report shows which of your site’s URLs are in Google’s index and explains why the others were left out. The most common reasons are:
- Crawled, currently not indexed: Google read the page and decided not to include it, often because the content is thin or repetitive;
- Discovered, currently not indexed: Google knows the page exists but hasn’t crawled it yet;
- Duplicate without user-selected canonical: there are very similar pages competing with each other;
- Excluded by ‘noindex’ tag or Blocked by robots.txt: someone asked Google not to index the page;
- Not found (404) and Page with redirect: addresses that no longer exist or that send visitors somewhere else.
Not every page outside the index is a problem: login pages, internal search pages and redirected pages are supposed to stay out. The red flag goes up when an important page shows up on this list. The same menu holds the Sitemaps report and the Removals tool, which hides a URL from search results for about six months while you fix the problem for good.
URL Inspection in Google Search Console
The Search Console URL Inspection tool shows the status of a specific page: whether it’s in the index, when it was last crawled, which version Google considers canonical and whether it has valid structured data.
Just paste the address into the search bar at the top. With the “Test live URL” button, you check the current version of the page, and with “Request indexing” you ask Google to crawl it again, which comes in handy after you publish or update content. There’s a daily limit on requests per property, so save it for the pages that really matter.
Core Web Vitals and HTTPS in Search Console
The Search Console Core Web Vitals report shows the real experience of your visitors, with field data from Chrome (the Chrome UX Report, or CrUX), split between mobile and desktop. The assessment is based on the 75th percentile of visits over the last 28 days. There are three metrics:
| Metric | What it measures | Good |
|---|---|---|
| LCP (Largest Contentful Paint) | How long it takes for the largest element on the page to appear | up to 2.5 seconds |
| INP (Interaction to Next Paint) | How quickly the page responds to clicks and taps | up to 200 milliseconds |
| CLS (Cumulative Layout Shift) | How much the page “jumps around” while it loads | up to 0.1 |
Search Console groups similar pages and shows which ones are rated “Good”, “Needs improvement” or “Poor”. To find out what’s slowing a page down, test the URL in PageSpeed Insights or Lighthouse, which is built into Chrome, and share the suggestions with whoever manages your site.
The HTTPS report, right next to it, shows whether your pages use a secure connection. Together, the two replace the old Page Experience report.
Rich results, Security issues and Manual actions in Search Console
The Search Console rich results reports (under Enhancements) show whether your site’s structured data (FAQ, product, reviews, video, breadcrumbs) is set up correctly to generate visually enhanced results, known as rich results. Structured data follows the Schema.org vocabulary and is usually written in JSON-LD, a block of code that plugins like Yoast and Rank Math generate automatically. When there’s an error, the report points to the page and the field with the problem, and Google’s Rich Results Test helps you check the fix before you validate it.
The Security issues and Manual actions reports, on the other hand, warn you when your site has been hacked, has malware or received a manual penalty for violating Google’s guidelines. These are rare but urgent alerts: Search Console sends you an email, and the fix needs to come before you request a review.
Search Console Links report
The Search Console Links report shows the sites that link to you most, your most linked pages and the most common anchor texts, for both external links (backlinks) and internal links. It’s a sample, not the full list of links, but it already helps you see which content attracts the most references and which important pages get few internal links.
Search Console Settings: Crawl stats, robots.txt report and Change of address
Google Search Console Settings hold three lesser-known but very useful features:
- Crawl stats: show how many times Googlebot visited the site, your server’s response time and any errors found. They help you spot whether the site is slow for the bot or down at certain times;
- robots.txt report: shows the version of the robots.txt file that Google read and whether it has errors, so you don’t accidentally block important pages;
- Change of address: tells Google when your site moves to a new domain (for example, from a .net to a .com), along with 301 redirects, so the migration loses as little traffic as possible.
Settings is also where you manage users and associations with other Google tools, such as Google Analytics.
How to use Google Search Console to get useful insights
This is where Google Search Console stops being a dashboard full of numbers and becomes a decision-making tool. The best insights come from combining four pieces of data: the query, the page, the position and the CTR.
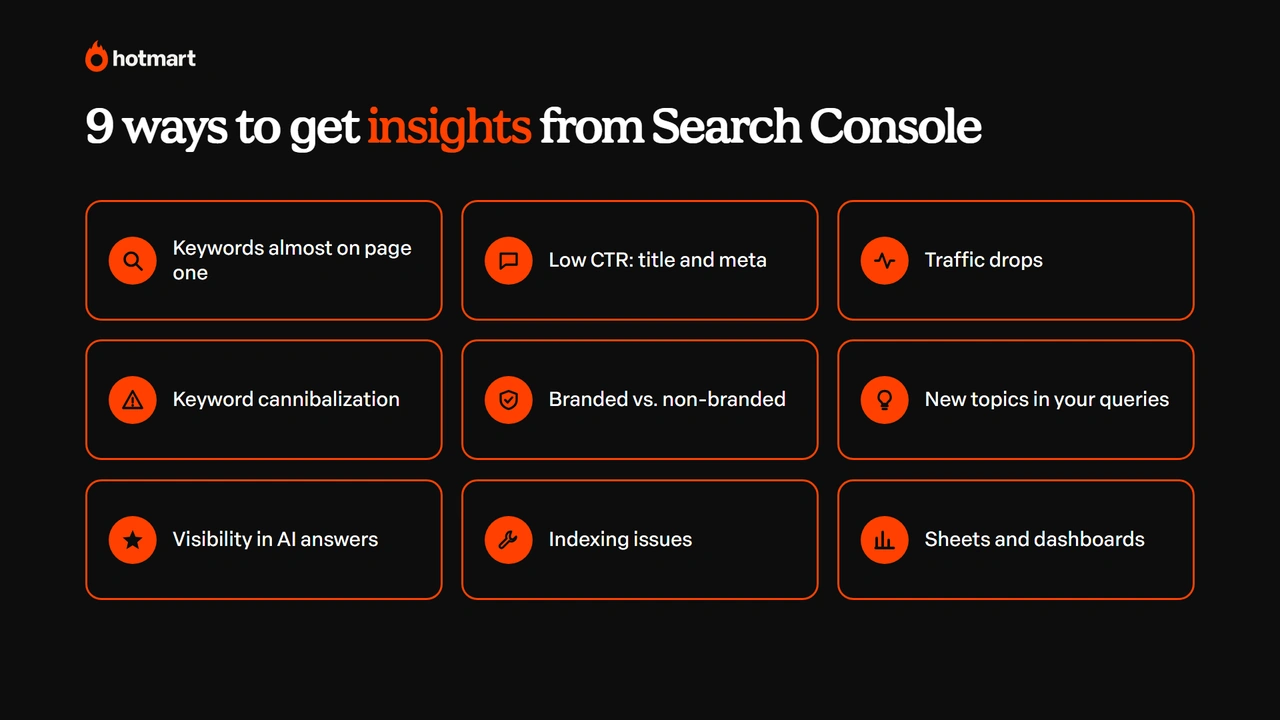
Below are 9 practical ways to use Search Console to grow on Google:
- find the keywords that are almost on the first page;
- improve CTR with your title and meta description;
- investigate traffic drops;
- find keyword cannibalization;
- separate branded searches from non-branded searches;
- discover new topics from your queries;
- track your site’s presence in AI answers;
- fix indexing issues;
- take the data to spreadsheets and dashboards.
Each one shows you where to look and what to do.
1. Find the keywords that are almost on Google’s first page
Queries between positions 8 and 20 are the quickest wins in Search Console: Google already considers your page relevant, but it still doesn’t show up much.
Where to look: in Performance, turn on the impressions and average position metrics, open the Queries tab and sort by impressions. Write down the queries with a position between 8 and 20 and lots of impressions.
What to do: open the page that ranks for each query and check whether it really answers that search. Often, it’s missing a specific topic, a more direct answer up front, an updated example or internal links pointing to the page.
Example: imagine your page on “how to create an online course” shows up for the query “how much to charge for an online course” in position 11, with 3,000 impressions and only 15 clicks a month. Google already connects the page to the topic, but it doesn’t answer that question well. A new section on how to price a digital product, with the answer right at the start, could move the page to the first page and multiply your clicks.
2. Improve CTR with your title and meta description
A page with lots of impressions and few clicks is being seen, but not chosen.
Where to look: in Performance, Pages tab, turn on CTR and average position. Compare pages with similar positions: if one has a much lower CTR than the others in the same range, the problem is probably the title or the description.
What to do: rewrite the SEO title and meta description (which improves your click-through rate, the CTR) with the keyword at the beginning, a clear promise and the content format. For example:
- before: “Search Console: everything about the tool”;
- after: “Google Search Console: Complete Guide and How to Get Insights”.
Once it’s live, add an annotation to the chart and compare the CTR over the following weeks.
3. Investigate traffic drops in Search Console
Before reacting to a drop in clicks, use Search Console to find the cause (position, demand or CTR), because each one calls for a different action.
Where to look: in Performance, use the date comparison (for example, the last 3 months against the same period last year) and analyze the Queries and Pages tabs.
What to do:
- position dropped: the content lost relevance or a competitor got better; it’s worth updating the text;
- impressions dropped, but position held steady: demand went down, which may be seasonality. Google Trends helps confirm whether interest in the topic dropped overall;
- position held steady, but CTR dropped: something new on the results page (like an AI Overview) is grabbing attention.
Annotations help a lot here: mark site changes and important publications so you don’t have to rely on memory. To find out whether a drop lines up with an algorithm update (core updates, for example), check the Google Search Status Dashboard, where Google itself logs the start and end of each update.
4. Find keyword cannibalization
Cannibalization happens when two or more pages on the same site compete for the same search, and Search Console is the simplest way to catch it.
Where to look: in Performance, filter by an important query (Query > contains) and open the Pages tab. If several URLs show up with meaningful impressions, they’re competing.
What to do: keep the page that’s strongest in clicks and position. The weaker one can be reworked to serve a different search intent, or have its content merged into the main page, with a 301 redirect. When both pages need to stay live (such as nearly identical versions of the same content), the canonical tag (rel=”canonical”) tells Google which one is the main version.
5. Separate branded searches from non-branded searches
Searches for your brand name show who already knows you; non-branded searches show whether your SEO is bringing in new people. Mixing the two can hide a problem.
Where to look: in Performance, use the branded queries filter. It’s powered by a Google AI system that recognizes your brand across different languages, with typos and product names. The filter is available for properties with enough volume (it doesn’t apply to subdomain properties or properties for a single site folder).
What to do: track the growth of non-branded searches as the main metric of your SEO strategy. If only branded searches are growing, your content isn’t reaching new audiences yet.
6. Discover new topics from Search Console queries
Search Console queries are a list of real questions your audience asks on Google. Many of them still don’t have a proper answer on your site.
Where to look: in Performance, filter queries with a regular expression to find questions. An example filter: ^(how|what|which|why|when|where|who|can|is|does)\b. In Insights, query groups show the fastest-growing topics.
What to do: questions with lots of impressions and a poor position can become new sections, FAQ answers or even a standalone piece of content when they don’t fit on the current page. To check the search volume for each topic before writing, combine the data with Google Keyword Planner and bring it all together in a content-driven marketing strategy.
7. Track your site’s presence in AI answers
With search increasingly driven by AI, knowing whether your pages show up in AI Overviews and AI Mode has become part of the job in SEO and GEO (Generative Engine Optimization, optimizing for generative AI engines). AI Mode, for example, uses a technique called query fan-out: it breaks the person’s question into several related searches and builds the answer with snippets from different pages. That’s why content that also answers the related questions around a topic is more likely to show up.
Where to look: in the generative AI features performance report, see which pages get impressions and compare them with your strongest pages in the overall Performance report.
What to do: pages that show up in AI answers tend to have direct answers, original data and up-to-date content. Apply these patterns to the content that isn’t showing up yet: start each section by answering the question, include numbers with sources and keep information current.
8. Fix indexing issues in Search Console before they cost you traffic
An important page outside the index is lost traffic, and Search Console shows you this before you notice the drop.
Where to look: in Page indexing, open each reason a page isn’t indexed and look for the pages that should be on Google.
What to do: fix the cause (removing an unintended noindex, adjusting robots.txt, improving thin content, consolidating duplicates) and use URL Inspection to request indexing again. Then click Validate fix in the report so Google can check the rest of the URLs.
9. Take Search Console data to spreadsheets and dashboards
The Search Console interface is great for quick analysis, but it’s limited to 1,000 rows per table and 16 months of history. For bigger analyses, it’s worth taking the data elsewhere.
Where to look: the Export button, at the top of the reports, generates files for Google Sheets, Excel or CSV.
What to do: for ongoing tracking, connect Google Search Console to Looker Studio and build a dashboard. To keep your full history and analyze every query, use the Google Search Console API or bulk data export to BigQuery.
With these 9 uses, Search Console becomes a routine of continuous improvement, not a dashboard you only open when something goes wrong.
Tips for using Google Search Console day to day
Google Search Console pays off most when it becomes a habit. A simple routine already helps you avoid surprises and spot opportunities:
- every week: check the Performance report and Insights, and look at the pages and queries that are rising or falling;
- every month: review Page indexing, Core Web Vitals, the generative AI report and the queries in the position 8 to 20 range;
- after publishing or updating: inspect the URL, request indexing and add an annotation to the chart;
- whenever you get an email from Search Console: read it, because it warns you about new errors, security issues and manual actions.
A few precautions also help you avoid the wrong conclusions. Always compare periods of the same length and with the same days of the week. Look at position together with impressions, because a page can “move up” in position just by showing up in fewer searches. And don’t react to changes over one or two days: wait for the trend to hold, ideally in the weekly view.
If you’re just getting started, this checklist will help you get Search Console ready in a day:
- Domain property created and verified through DNS;
- sitemap submitted and read without errors;
- homepage and most important pages inspected and indexed;
- Search Console connected to Google Analytics 4;
- team members added with the right access level;
- first chart annotation created, marking the start of your tracking.
One extra tip: Bing has its own tool, Bing Webmaster Tools, which lets you import sites already verified in Google Search Console in just a few clicks. It’s worth turning on to also track traffic from Bing, which powers AI assistants like Copilot.
With this routine, Search Console shows you not only what happened, but what to do next.
How Google Search Console helps you sell digital products
If you sell an online course, ebook, mentorship or community, Google Search Console shows you where your audience comes from without any ad spend. And that organic audience tends to be the most qualified: these are people who actively searched for the subject you teach.
Below are four ways to use Search Console for your digital business:
- tracking your blog and sales page on Google;
- turning queries into content and product ideas;
- measuring your social media profiles;
- combining search data with sales data.
Blog and sales page tracked in Search Console
Verifying your blog and sales page domain in Search Console lets you see which searches lead to your offer and whether your pages are indexed correctly. The questions that show up in your queries are gold for the copy and the FAQ on your sales page, because they reveal the real objections of people who are researching. If you’re still planning yours, here’s how to start a blog from scratch.
And if you don’t have a website yet, Hotmart Launchpad takes care of that part: you describe your idea in your own words and the AI builds your website, sales page or members area, published in one click, with domain, hosting and Hotmart checkout already included.
Search Console queries that become content and product ideas
The questions your audience asks on Google reveal the most common doubts in your niche. In Search Console, they show up with real impression volume, which helps you prioritize.
A question that keeps coming up can become a blog post, a new lesson, an extra module in your course or even a new digital product. If lots of people search for “how to price” within your topic, for example, there may be room for dedicated material on just that.
Social media profiles also have data in Search Console
Since July 2026, Search Console has had platform properties, which show how Instagram, TikTok, X and YouTube profiles appear in Google Search and Discover. For creators who sell through social media, even without their own website, this is an important new feature.
With them, you find out which Google searches lead to your posts and videos, which content performs best and how people find your account.
Combine Search Console data with sales data
Search Console shows demand; sales data shows results. Together, they reveal which topics bring in not just visits, but customers.
At Hotmart, Hotmart Dashboards show revenue, subscriptions, churn and LTV in real time. And with the Hotmart MCP, you connect your account to Claude or ChatGPT and ask, in natural language, how much you sold in a given week to compare it with organic traffic over the same period. That makes it easier to decide where to invest your content production time.
So, ready to put Google Search Console to work for you?
Google Search Console is free, takes just a few minutes to set up and replaces guesswork with official data from Google. The biggest opportunities are in the Performance report: keywords almost on the first page, pages with low CTR and audience questions your site doesn’t answer yet.
And it becomes even more useful when it turns into a routine and when search data is combined with sales data. That’s how organic traffic stops being just visits and starts driving real results for your business. 💡
Frequently asked questions about Google Search Console
Still have questions? Below, we answer some of the most frequently asked questions about Google Search Console.
How long does Search Console take to show data?
Once your site is verified, Google Search Console starts collecting data, and the first numbers show up within a few days. Day to day, the most recent data comes in as preliminary and is finalized over the following days. To keep up with what just happened, use the last 24 hours view in the Performance report.
How long does Search Console keep data?
Google Search Console keeps the last 16 months of performance data. To keep a longer history, export the data regularly to spreadsheets, connect the tool to Looker Studio or use bulk data export to BigQuery.
Why isn't my page showing up on Google even though it's in the sitemap?
Being in the sitemap doesn't guarantee indexing: the sitemap only tells Google that the page exists. The page may have been left out because of thin or duplicate content, a noindex tag, a robots.txt block or because Google hasn't crawled it yet. Search Console's URL Inspection tool shows you the exact reason.
Can I use Search Console without a website?
Yes. Since July 2026, Google Search Console has had platform properties, which let creators track how their Instagram, TikTok, X and YouTube profiles appear in Google Search and Discover, even without their own website.
Does Search Console show traffic from AI Overviews and AI Mode?
Partly. Google Search Console's generative AI features performance report shows your pages' impressions in AI Overviews and AI Mode, by page, country, device and date. Clicks from these features are included in the overall Performance report, with no separate breakdown in the dedicated report.